通过RFM分析进行客户细分
The project strategically uses RFM analysis to segment online sales customers, providing insights into distinct groups like high-value customers, loyal customers, and those at risk of churning.
Project Goals
The data is derived from real-life scenarios of an online company.
- Leveraging RFM analysis, categorize customers into high-value, loyal, and at-risk groups. Maximizing Marketing ROI focuses efforts on high-conversion potential segments, maximizing campaign effectiveness.
- Analyzing Purchase Recency targets both recent and inactive customers, while Frequency Analysis identifies and retains loyal customers. This enables Churn Prediction to anticipate and proactively retain at-risk customers.
- Optimizing Inventory and Promotions utilizes purchasing patterns for effective planning.
- Identifying Valuable Customers involves prioritizing high spenders for tailored strategies, while Customized Marketing Strategies and improving Customer Experience utilize RFM insights for personalized campaigns and enhanced personalization.
RFM Analysis
RFM segmentation is a marketing analysis method that entails examining customer behavior through three fundamental factors: recency, frequency, and monetary value. This analytical approach assists businesses in classifying customers into segments, facilitating the development of targeted and personalized marketing strategies.
- Recency (R): how recent was each customer's last purchase.
- Frequency (F): how many purchases the customer has done in the last 12 months.
- Monetary value (M): how much the customer has spent in the last 12 months.
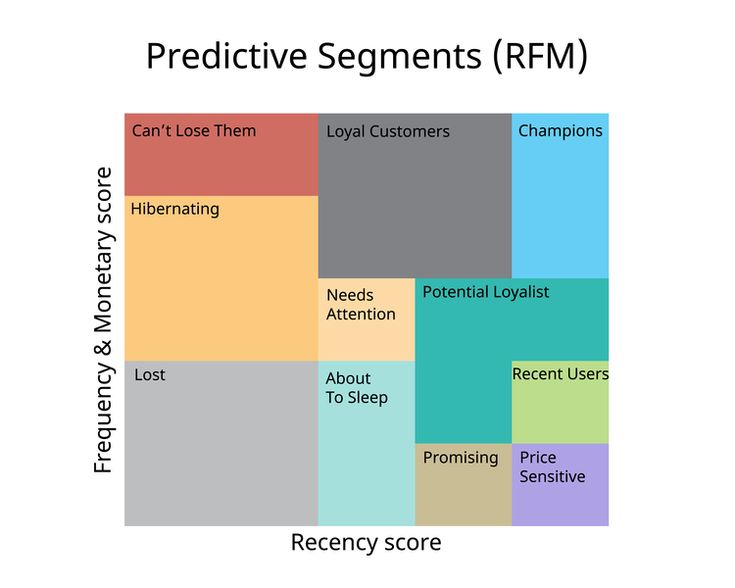
The benefits of RFM analysis
Below are some advantages of RFM analysis:
- Customer Segmentation: RFM analysis helps in segmenting customers based on their recent purchase behavior, how often they make purchases, and the monetary value of their transactions. This segmentation allows businesses
- Targeted Marketing: By understanding the behavior of different customer segments, businesses can create more targeted and personalized marketing campaigns. This increases the relevance of the marketing messages, leading to higher engagement and conversion rates.
- Customer Retention: Identifying and addressing the needs of high-value customers and those at risk of churn is crucial for customer retention. RFM analysis helps businesses prioritize their efforts and resources on retaining valuable customers and re-engaging those showing signs of decline.
- Optimized Resource Allocation: RFM analysis enables businesses to allocate resources more efficiently. For instance, it helps identify which customer segments are most likely to respond to promotions or discounts, allowing businesses to focus their efforts where they are likely to yield the best results.
- Product and Service Tailoring: Understanding the purchasing behavior of different customer segments allows businesses to tailor their products or services to better meet the specific needs and preferences of those segments.
- Profitability Improvement:Customer Retention: By focusing on high-value customers and encouraging increased frequency and spend, businesses can enhance overall customer profitability. RFM analysis helps identify opportunities for upselling or cross-selling to existing customers.
- Data-Driven Decision-Making: RFM analysis relies on data-driven insights, providing a quantitative basis for decision-making. This ensures that marketing strategies and efforts are based on actual customer behavior rather than assumptions.
In summary, RFM analysis is a valuable tool for businesses seeking to enhance their marketing efforts, improve customer satisfaction, and drive overall profitability by understanding and leveraging customer behavior data.
How to perform a RFM analysis: steps and process
- Calculate RFM values: The first step is to have clarity in your goals. What do you want to understand from the data that you have? What do you want to learn from this analysis and how will it help your business?
- Grouping RFM values:
- Percentiles: e.g. quantiles: qcut()
- Sort customers based on that metric
- Break customers inot a pre-defined number of groups of each size
- Assign a label to each group
- Highest score to the best metric - best is not always highest e.g. recency
- In this case, the label is inverse - the more recent the customer, the better
Below are examples.
- Best Customers: Tailor communications to convey a sense of value and appreciation to this group, recognizing their role in contributing significantly to overall revenues. Prioritize efforts to maintain their satisfaction and delve into individual preferences for opportunities to enhance personalization in messaging.
- High-spending New Customers: Given their substantial initial spending, it is crucial to carefully nurture all new customers, emphasizing the importance of making them feel valued and appreciated. Similar to the approach with Best Customers, provide compelling incentives to foster continued engagement with the brand.
- Lowest-Spending Active Loyal Customers: While these loyal customers consistently engage, their spending levels are lower. Develop targeted campaigns to instill a sense of value, encouraging them to increase their spending. As loyal patrons, consider rewarding them with special offers, especially if they promote the brand among their friends through channels like social networks.
- Churned Best Customers: These are valuable customers who stopped transacting a long time ago. While it’s often challenging to re-engage churned customers, the high value of these customers makes it worthwhile trying. Like with the Best Customers group, it’s important to communicate with them on the basis of their specific preferences, as known from earlier transaction data.
Example: RFM analysis on online purchase history
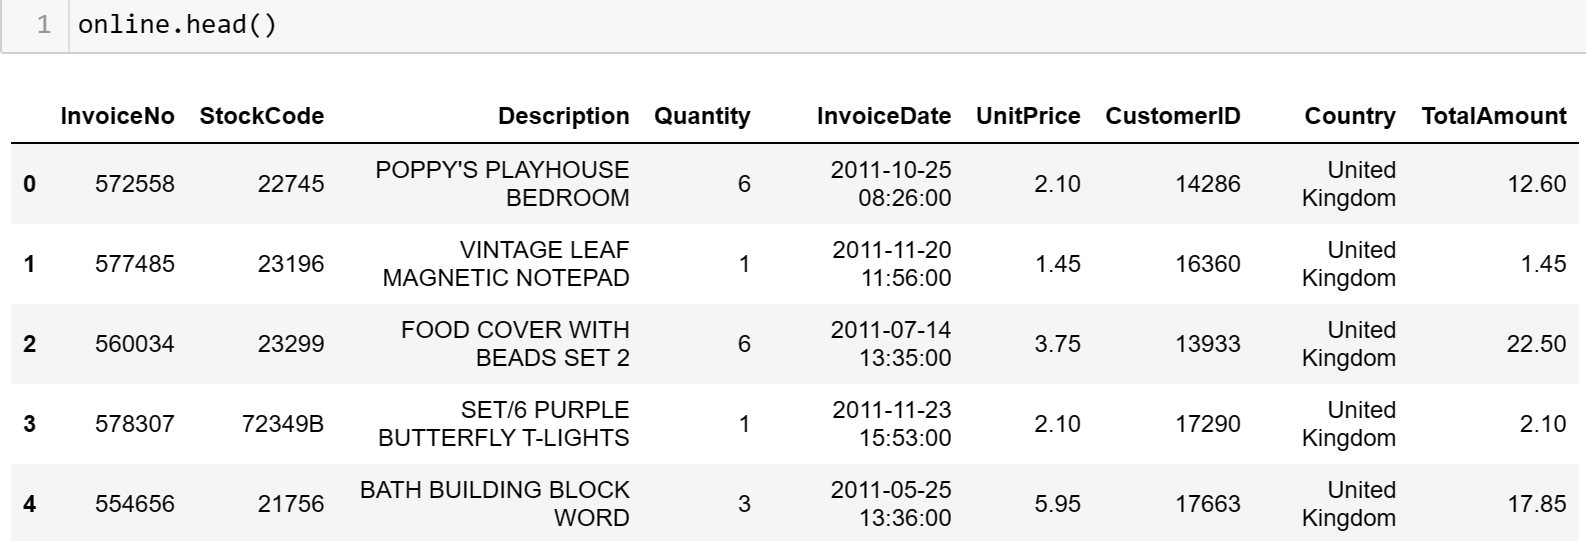
Calculate RFM values
- Building RFM segments:We will only calculate RFM based on 12 months from today or yesterday - create a hypothetical snapshot_day as a starting point as if we are doing analysis recency.

- Calculate RFM based on the customer level

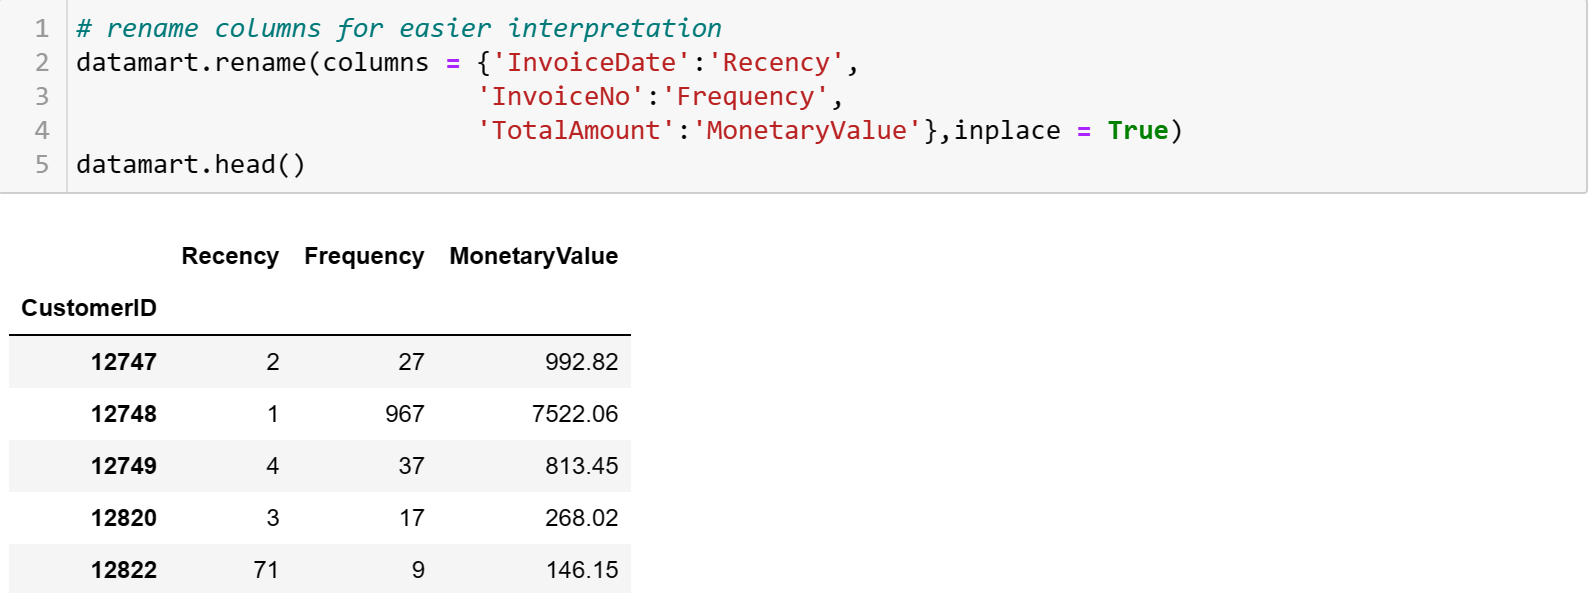
Building RFM segments
- Label recency, frequency and monetary value quartile


Calculate RFM segment and RFM score
- Concatenate RFM quartile values to RFM_segment
- Sum RFM quartile values to RFM_scare
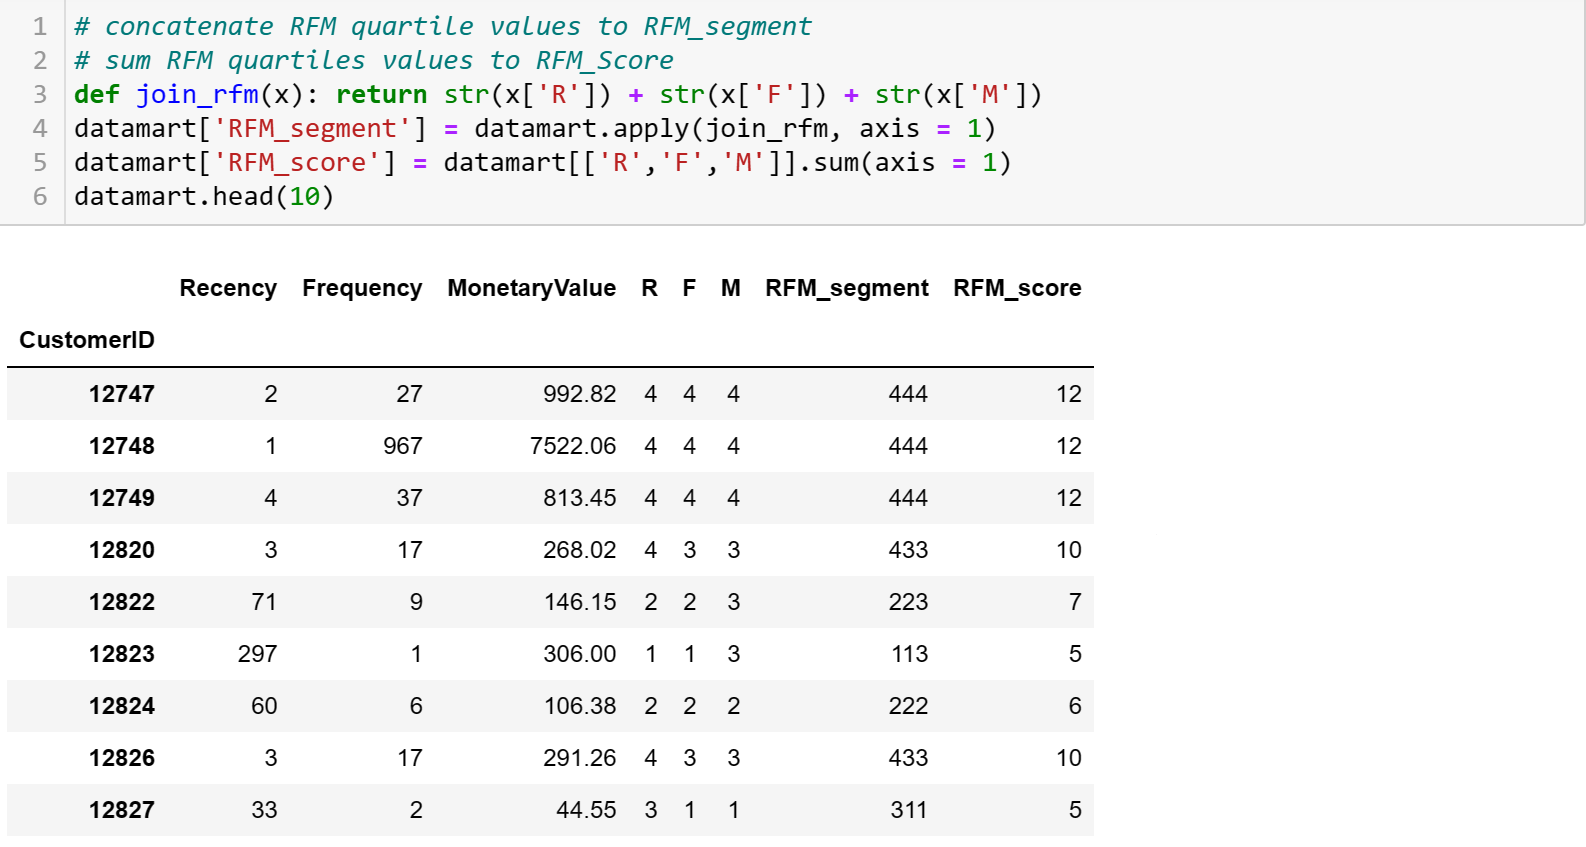
Analyzing RFM segments
- Review the largest segment.
- Select bottom RFM segment "111" and view top 5 rows.
- Observe the customers in each RFM group.
- Use RFM score to group customers into Gold, Silver and Bronze segments. (Note: The threshold is arbitrary.)


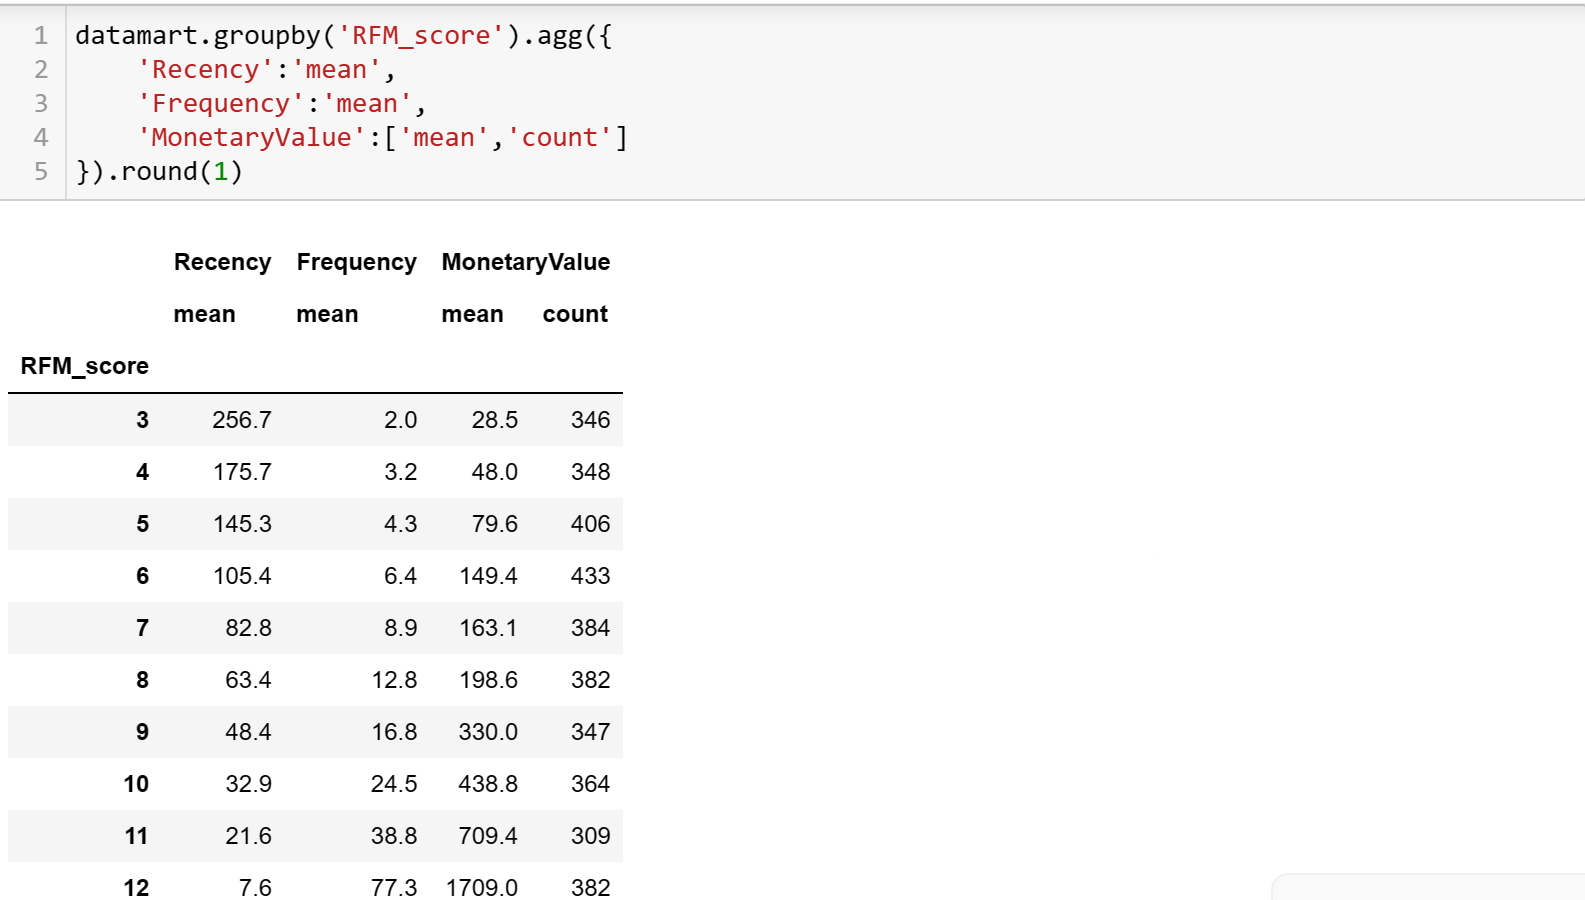
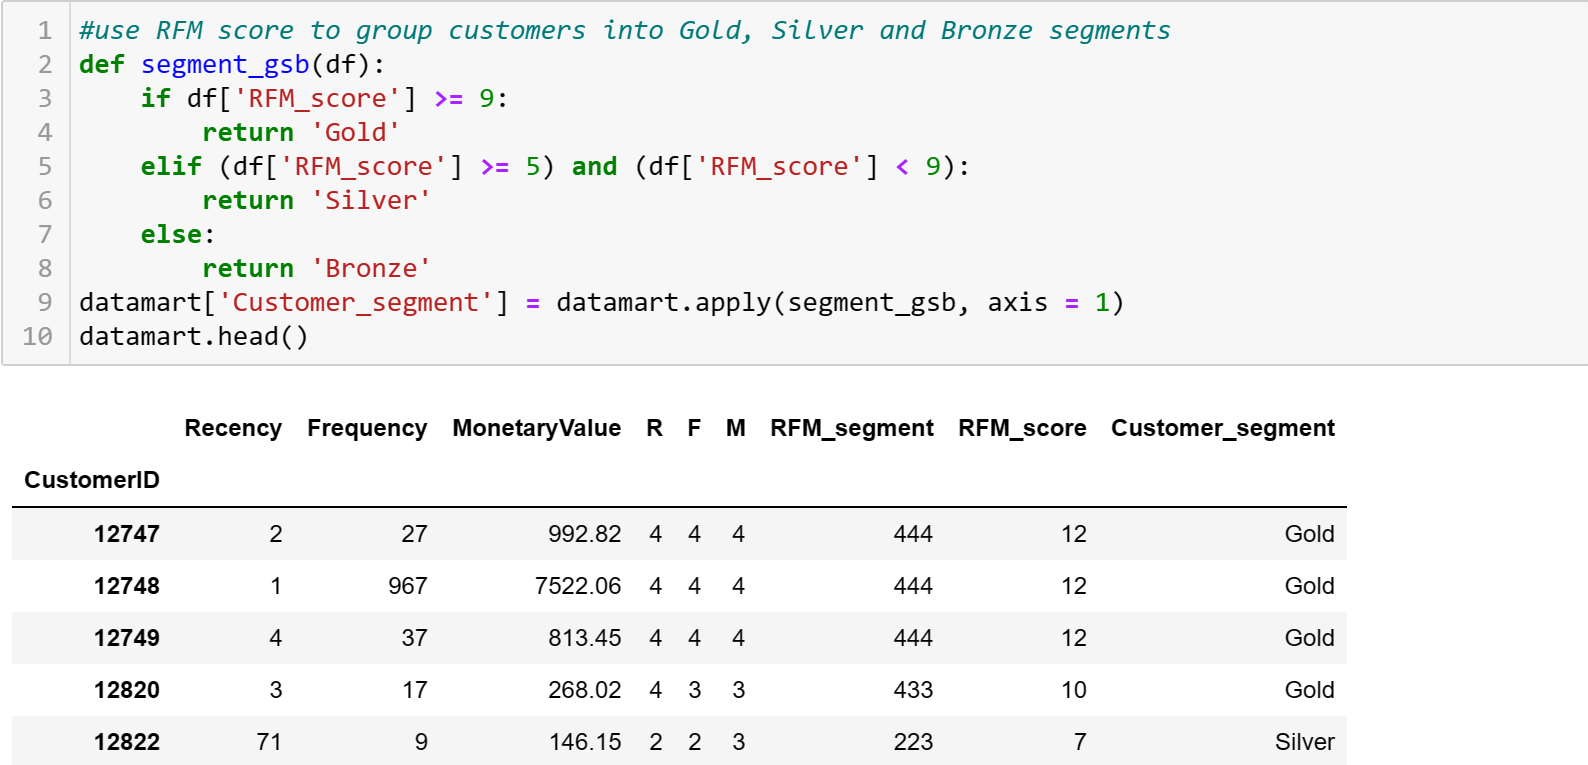
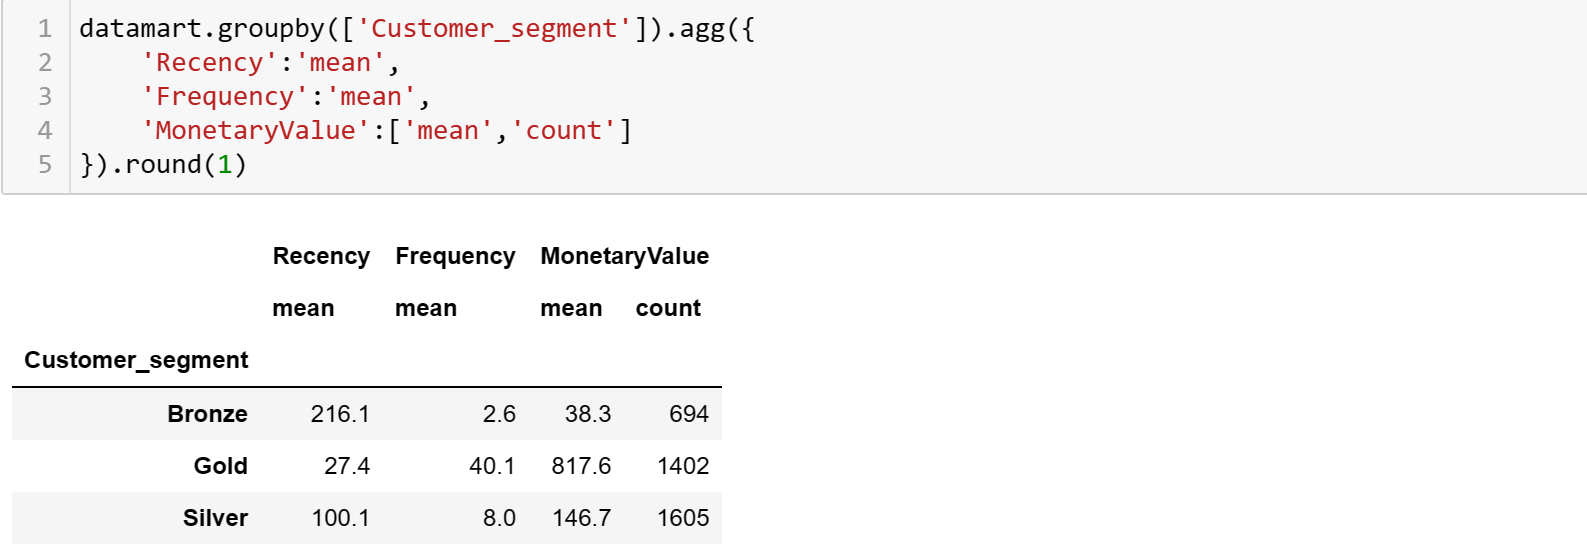
Further thoughts
How to selecting appropriate thresholds for RFM segmentation?
- Business Objective: Align thresholds with specific business objectives, setting higher values for Recency, Frequency, and Monetary Value to identify high-value customers.
- Data Distribution Analysis: Examine RFM score distribution for natural breaks or clusters, using statistical methods or visual exploration to identify meaningful segments.
- Equal-Sized Segments: Utilize quantiles or percentiles (e.g., quartiles or quintiles) for roughly equal-sized customer segments.
- Domain Knowledge: Apply industry expertise to set thresholds aligned with typical customer behavior in the specific business environment.
- Experimentation: Experiment with different threshold values and monitor segment performance over time. Adjust thresholds based on observed results for continuous improvement.
- Customer Feedback: Incorporate insights from sales and customer service teams, leveraging frontline feedback for a nuanced understanding of customer preferences.
Advanced Techniques
- K-Means Clustering: Apply unsupervised machine learning to identify natural groupings. Determine the optimal cluster number (k) through analysis or experimentation.
- Data Distribution Analysis (without Clustering): Visual exploration using histograms or other tools to unveil patterns. Guide threshold decisions based on observed data distribution.
Ultimately, this integrated approach combines strategic alignment, data-driven analysis, and iterative refinement, offering a robust framework for setting RFM score thresholds tailored to the specific needs and nuances of a business.