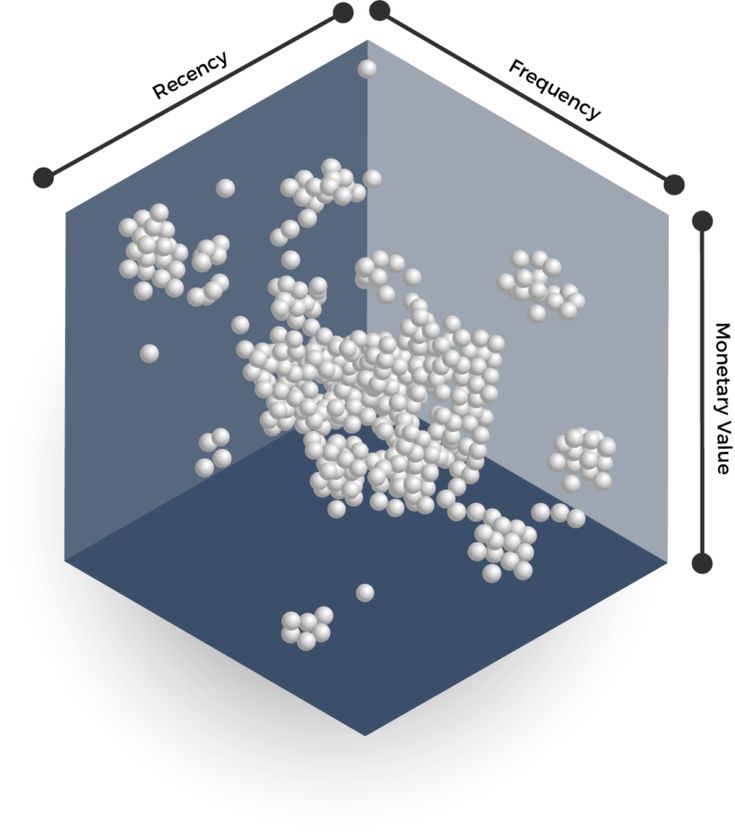
Customer Segmentation through RFM analysis
The project uses RFM analysis to segment online sales customers, revealing high-value, loyal, and at-risk groups.
The project strategically segments online sales customers using cohort analysis, providing insights into retention, purchasing patterns, and engagement
The data is derived from real-life scenarios of an online company.
Cohort analysis is indeed a descriptive analytics tool used to group customers into mutually exclusive cohorts, allowing for the measurement and comparison of metrics over time. the tool is valuable for comparing metrics across both the product lifecycle and customer lifecycles.
Cohorts can be defined based on various criteria, and the type of cohort often depends on the specific context of analysis.
The cohort table is similar to a pivot table. It comprises three elements: the assigned cohort in rows, cohort index in columns, and metrics within the table.
The first step is to have clarity in your goals. What do you want to understand from the data that you have? What do you want to learn from this analysis and how will it help your business?
Do you want to understand more about customer behavior, like how they landed on your website or how much time they spent on an app? Or do you want to understand at which point they are churning? These answers will help you identify which cohorts to track and which metrics to choose.
Conversion rate
Retention rate
Average purchase value
Customer lifetime value
Engagement rate
Churn rate
Customer satisfaction
You need to consolidate relevant data like the date of first purchase or the total amount spent.
Once you have collected the data, you can use different methods of analysis like time series or regression to spot patterns. This will allow you to notice any critical changes that may have happened.

The cohort month is defined as the acquisition month, which is the oldest invoice month of each customer.


Creating a cohort index calculated in months and offset by 1 involves assigning each customer to a specific cohort based on the month they were acquired and then calculating the number of months since their acquisition, with an offset of 1.

For each month after the acquisition, count the number of active customers in each cohort. An active customer is one who made at least one purchase in a given month.

Customer retention rate = (No. of customer at the end of a period - No. of customers acquired during that period )/ No. of customers at the start of the period * 100


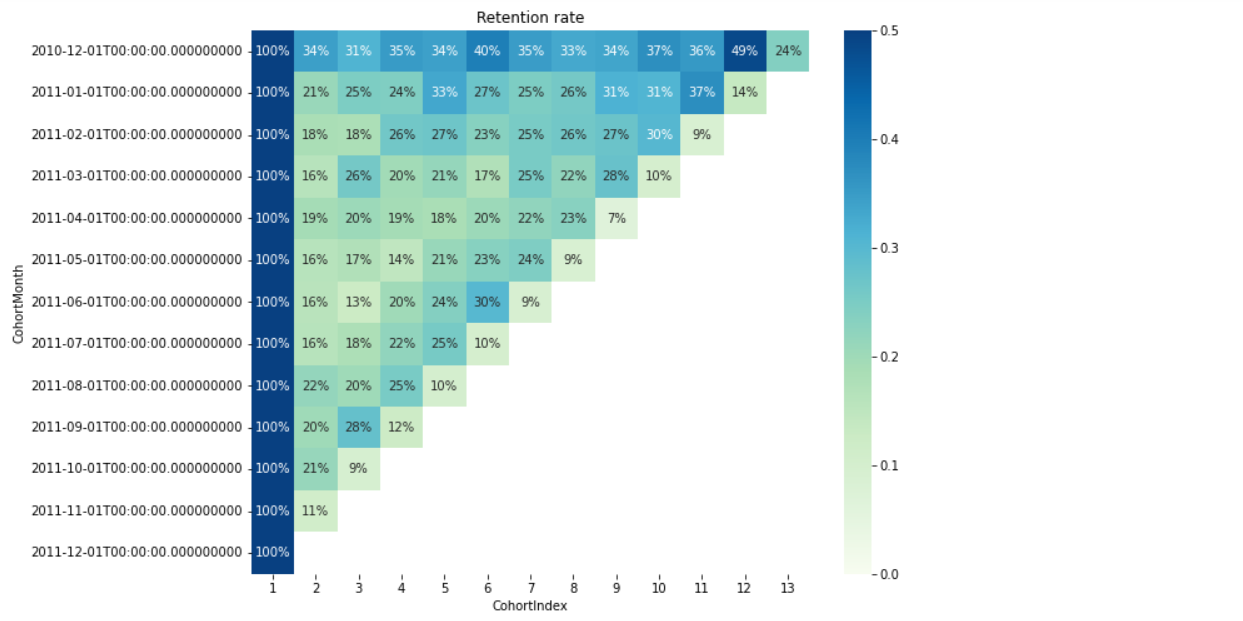
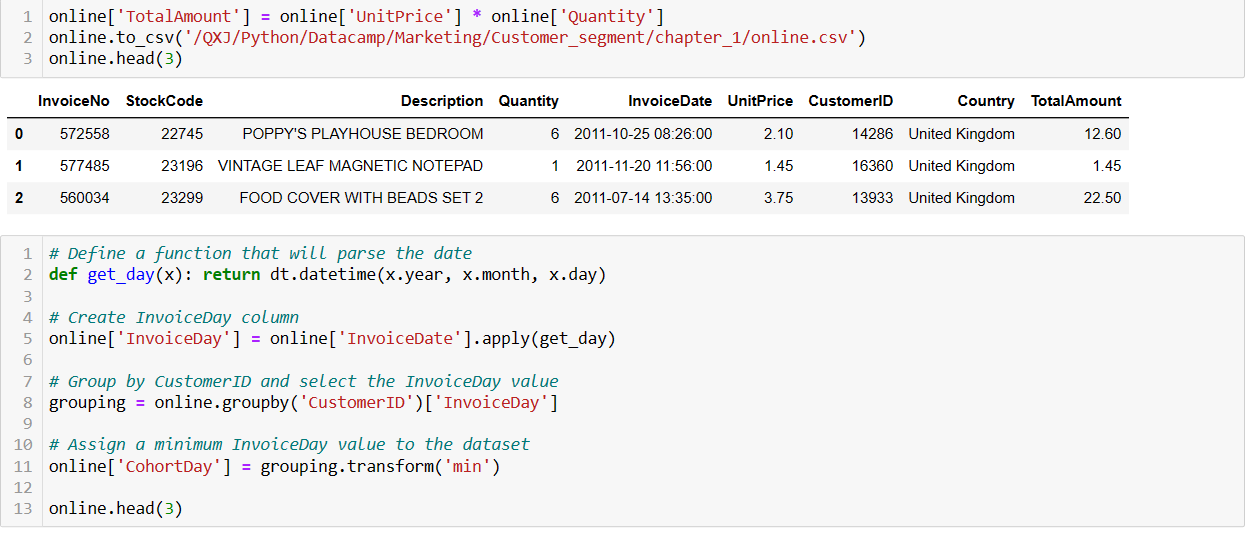

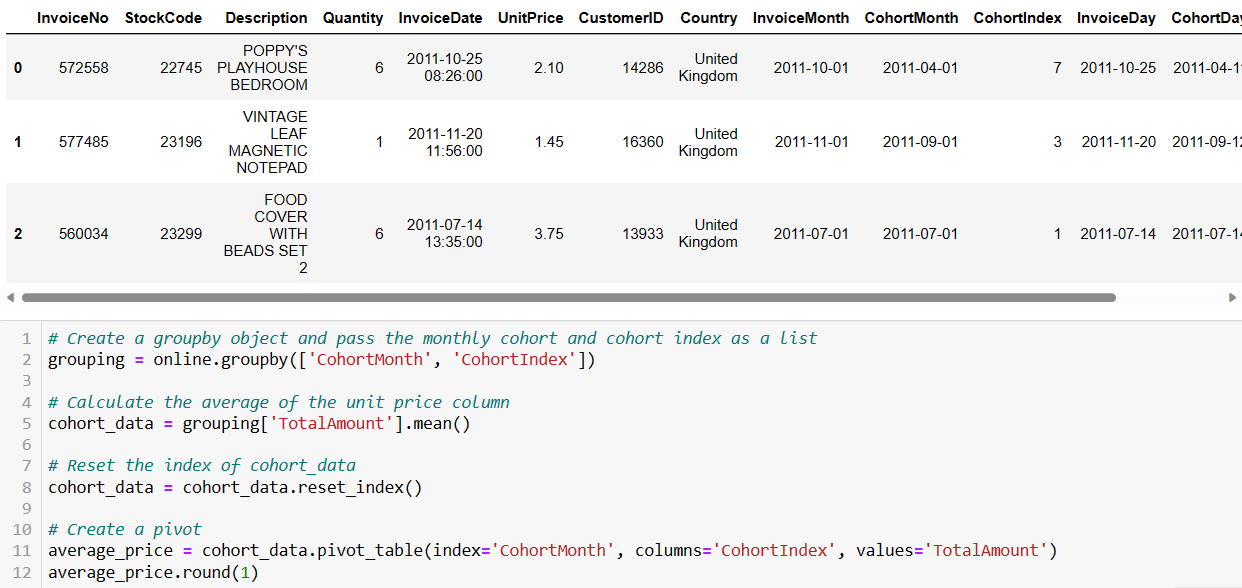
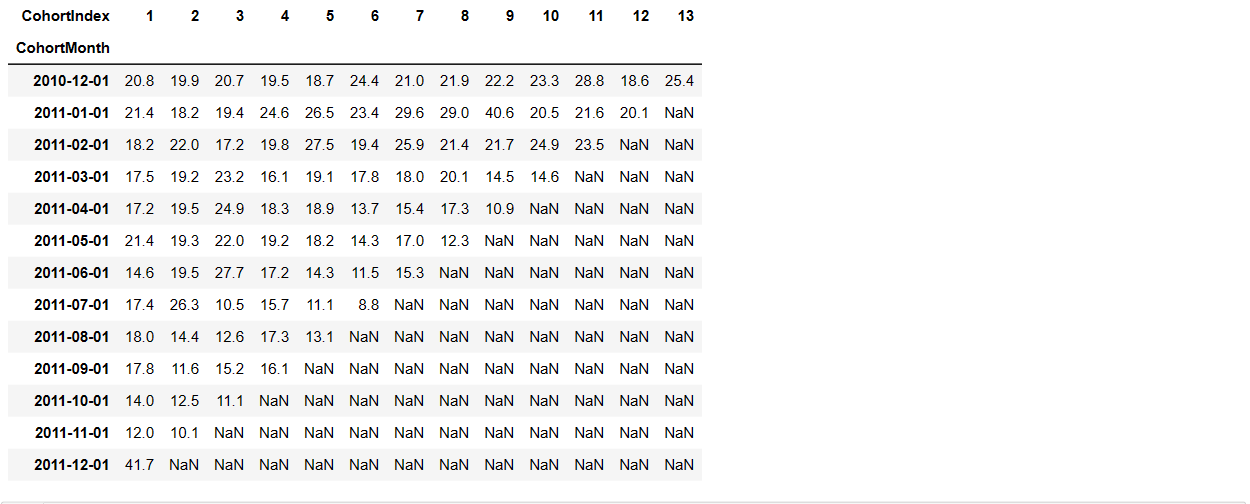
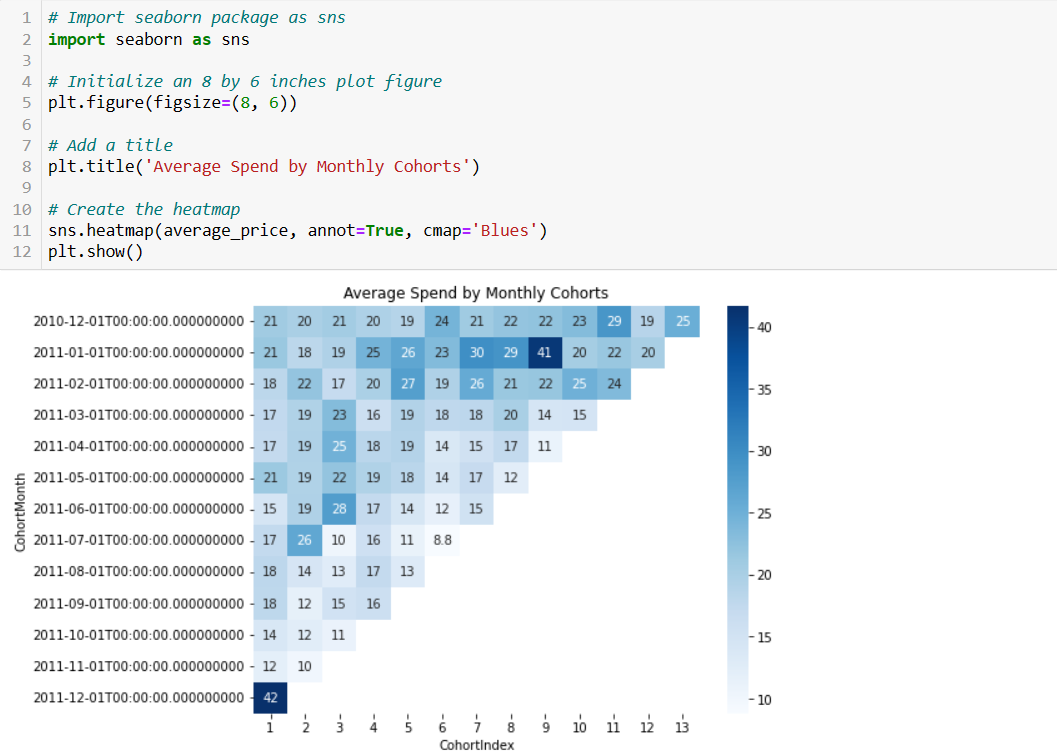
Cohort analysis helps businesses track and understand customer retention over time. By grouping customers based on their acquisition or conversion dates, companies can assess how well they retain customers and identify patterns or trends in customer behavior.
Businesses can use cohort analysis to evaluate the performance of specific products or services. By grouping customers who purchased a particular product within the same time frame, companies can assess the product's lifecycle, customer loyalty, and overall impact on revenue.
Cohort analysis allows marketers to assess the success of different marketing campaigns by grouping customers based on the time they were acquired through those campaigns. This helps in understanding which campaigns contribute most effectively to customer acquisition and long-term value.
In the context of online platforms, cohort analysis is useful for tracking user engagement and identifying potential churn patterns. By analyzing cohorts of users based on sign-up dates, businesses can optimize user experiences and implement targeted strategies to reduce churn.
Cohort analysis is particularly relevant for subscription-based businesses. It helps in evaluating subscriber retention, understanding user behavior over subscription periods, and identifying factors influencing subscription renewals or cancellations.
Beyond customer-related applications, cohort analysis can be applied to employee performance. For example, grouping employees based on their start dates to assess training effectiveness, retention, and performance over time.
In finance, cohort analysis can be applied to evaluate the performance of financial products, investment portfolios, or the effectiveness of financial strategies. Cohorts may be based on the time of investment or the introduction of a financial product.
Cohort analysis is beneficial in educational settings to analyze student performance, engagement, and course effectiveness. Cohorts can be formed based on enrollment dates or the introduction of new curriculum elements.
For mobile applications, cohort analysis helps in understanding user behavior, feature adoption, and retention. Cohorts based on app download dates can reveal insights into how different user groups engage with the app over time.
In healthcare, cohort analysis can be applied to study patient outcomes based on the time of diagnosis, treatment, or intervention. This can assist in improving patient care and treatment strategies.