Customer Segmentation through Cohort Analysis
Segments online sales customers using cohort analysis, providing insights into retention, purchasing patterns, and engagement.
Assessing the profitability of converting long-term rentals to short-term
Watershed Properties, a residential property management company overseeing thousands of properties across 60 diverse U.S. neighborhoods, is currently presented with a time-sensitive opportunity. The company is exploring the potential profitability of transitioning long-term rental properties into short-term rentals, along with determining the break-even point for each property. This initiative is in collaboration with one of Watershed's prominent property owners.
The key steps in the analysis comprise the following:
The data is sourced from real-life scenarios.
I conducted a comprehensive analysis by modeling the correlation between nightly rental prices and occupancy rates for short-term rental properties. Utilizing data obtained from existing short-term rentals managed by various companies and owners, I developed a predictive model. This model was then applied to estimate the optimal short-term rental price that would maximize profits for each of Watershed’s client properties, assuming they were managed as short-term rental properties.
The metrics presented in my report derive from the summation of forecasted profits and anticipated capital investment associated with implementing my recommendation. These calculations consider various factors and are based on the assumption that the outlined recommendations are followed.
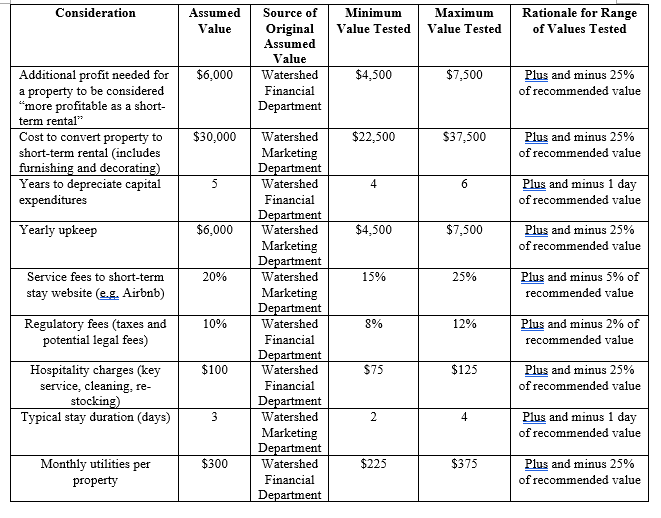
Assumption details are outlined in Table 1, followed by a summary of the sensitivity analysis results

As per the initial project agreement, certain issues were excluded from the analysis but could be considered in the future for optimizing short-term rental rates or enhancing the precision of projected profits (See Table 2):

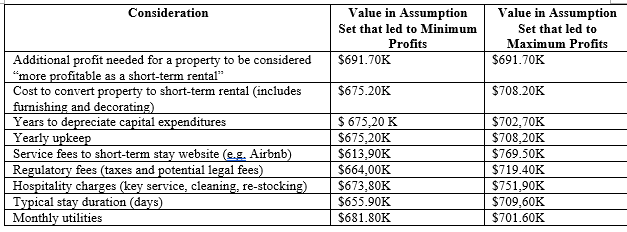
I've developed a dashboard showcasing the impact of adjusting these assumptions on anticipated profits and the required capital investment. This dashboard is available upon request to any team member. Notably, under modified assumptions, Watershed could potentially earn a minimum additional profit of $91.50K by converting 'more profitable' properties to short-term rentals. Conversely, the maximum additional profit could reach $247.10K under the same conditions. The specific parameters corresponding to these extremes are detailed in Table 3. Among these parameters, the most influential on profits was $155.60K.

I received information on four aspects of same-type short-term rentals in the same location as Watershed’s client’s 244 properties—number of bedrooms, apartment or house, kitchen availability, and property sharing status. This data included the typical nightly rental rate, the associated occupancy rate, the 10th percentile nightly rate, and the 90th percentile nightly rate. Notably, when typical rental prices were expressed in percentiles relative to similar properties, they exhibited a linear correlation with occupancy rates, although this correlation was not observed when analyzing raw dollar values.

I employed the parameters of the regression line along with Excel’s Solver optimization function to determine the rental price and occupancy rate maximizing profits for each of Watershed’s client’s 244 properties. Optimized prices falling below the 10th percentile rate were adjusted to the 10th percentile rate, and those exceeding the 90th percentile rate were adjusted to the 90th percentile rate, acknowledging the absence of data outside these ranges in the linear model. These optimized rates were then input into a financial cash flow and profit model, calculating expected revenue based on projected occupancy rates and costs as per the financial assumptions outlined.
Given Watershed's 1st-year conversion budget of $500,000, my recommendation is to convert a total of 11 long-term properties into short-term properties. Specifically, I recommend converting properties W66 and W67 in CA, W107 and W120 in TX, and W152, W155, W156, W163, and W164 in FL.
The foundational analysis supporting my recommendation suggests that Watershed and its client stand to gain an initial increase of $235.60K in profits during the first year, followed by annual profits of $169.30K thereafter, provided the recommendation is implemented. The required initial capital investment for enacting my recommendation is estimated to be $493.70K.
While this analysis is grounded in financial assumptions verified by both company and industry experts, sensitivity analyses indicate that Watershed should enter the short-term rental market with their client, even if initial assumptions undergo potential revisions. The analysis details the methodologies used to reach this conclusion and reports the results of sensitivity analyses, illustrating the impact on expected profits and required capital expenditure when assumptions are modified.
Attached below is the interactive dashboard for convenient reference and review of the results:
